Initiation of coverage · Consumer staples / retail
Costco Wholesale (NASDAQ: COST)
A wonderful business at a price that asks for perfection.
The full 8-page research note
Valuation model, football field, the bull-vs-our-view debate, and full disclosures. Free, no email required.
Our first HOLD — and it's on one of the best businesses we cover. That's the whole lesson: a wonderful company and a wonderful investment are not the same thing. The difference is the price.
The call
We're initiating on Costco with a HOLD and a $900 fair value.
Let's be clear up front: Costco is one of the best businesses in the world. A 92.2% U.S. renewal rate, a membership-fee annuity that grew 11% last quarter, 38% return on invested capital, net cash, and a culture that turns customer loyalty into a widening moat. Nothing in this report disputes the quality. This is the rare case where our HOLD is entirely about price, not the company.
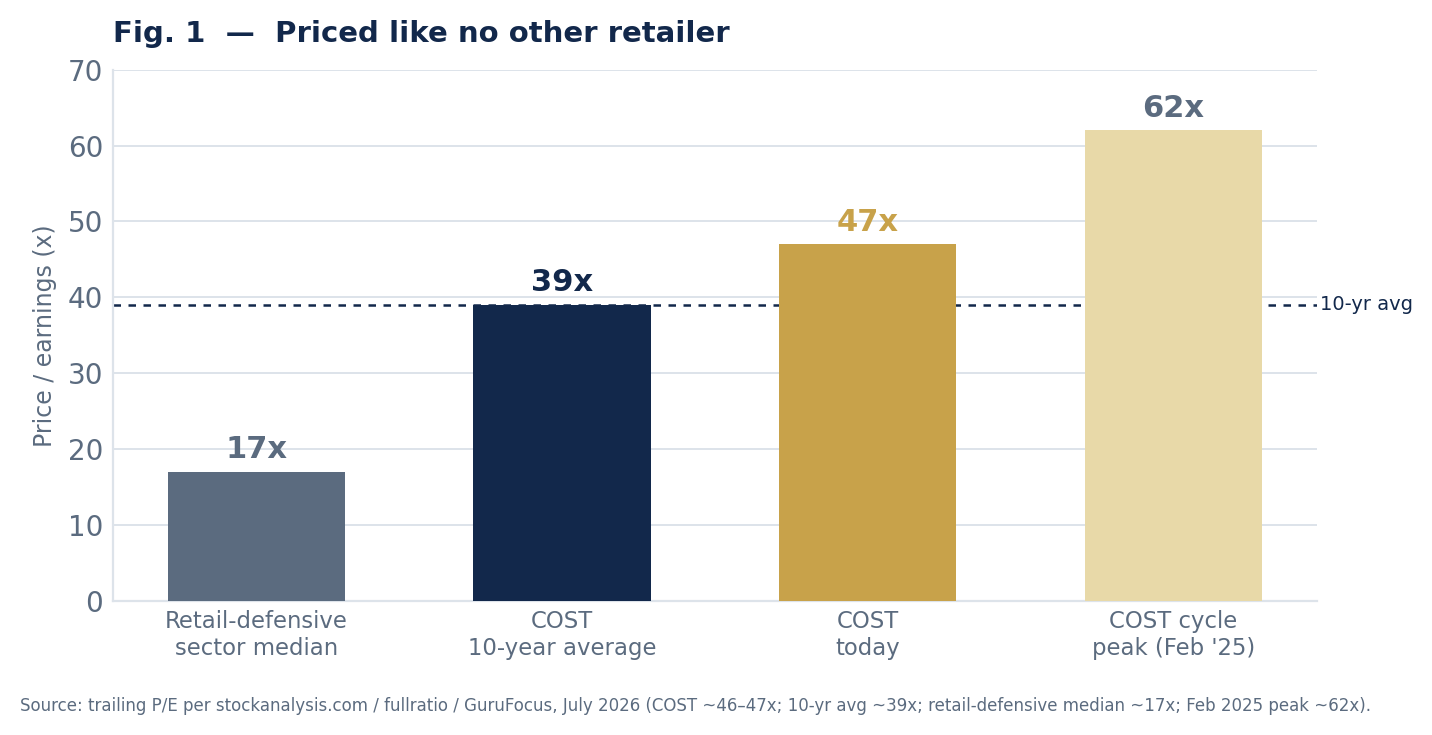
At roughly 47x trailing and ~41x forward earnings, COST trades toward the top of its own ten-year range and at nearly triple the retail-staples sector median. That multiple prices in a decade of flawless execution. The business can compound earnings at 10–12% for years and the stock can still go nowhere — or fall — if that premium simply normalizes toward its own history. The risk here isn't the company; it's the multiple.
So we'd rather wait. Our fair value of $900 sits a touch below the current price and well below the ~$1,077 street average. We'd become enthusiastic buyers in the low $800s, around a 34x multiple. Wonderful company; we're simply not willing to pay this price for it.
| Market cap | ~$408B | Trailing P/E | ~47× |
| Shares outstanding | ~443M | Forward P/E (FY26E) | ~45× |
| 10-year average P/E | ~39× | PEG ratio | ~3.9 |
| Dividend / yield | $5.88 / 0.63% | Renewal (U.S./Canada) | 92.2% |
| Paid members | 82.9M | ROIC | ~38% |
| Cash & investments | ~$20B | Beta | 0.87 |
| 52-week high | $1,096.50 | 52-week low | $844.06 |
| Street consensus | Hold | Street avg. target | ~$1,077 |
Why Costco deserves a premium (just not this one)
The membership model is the whole company
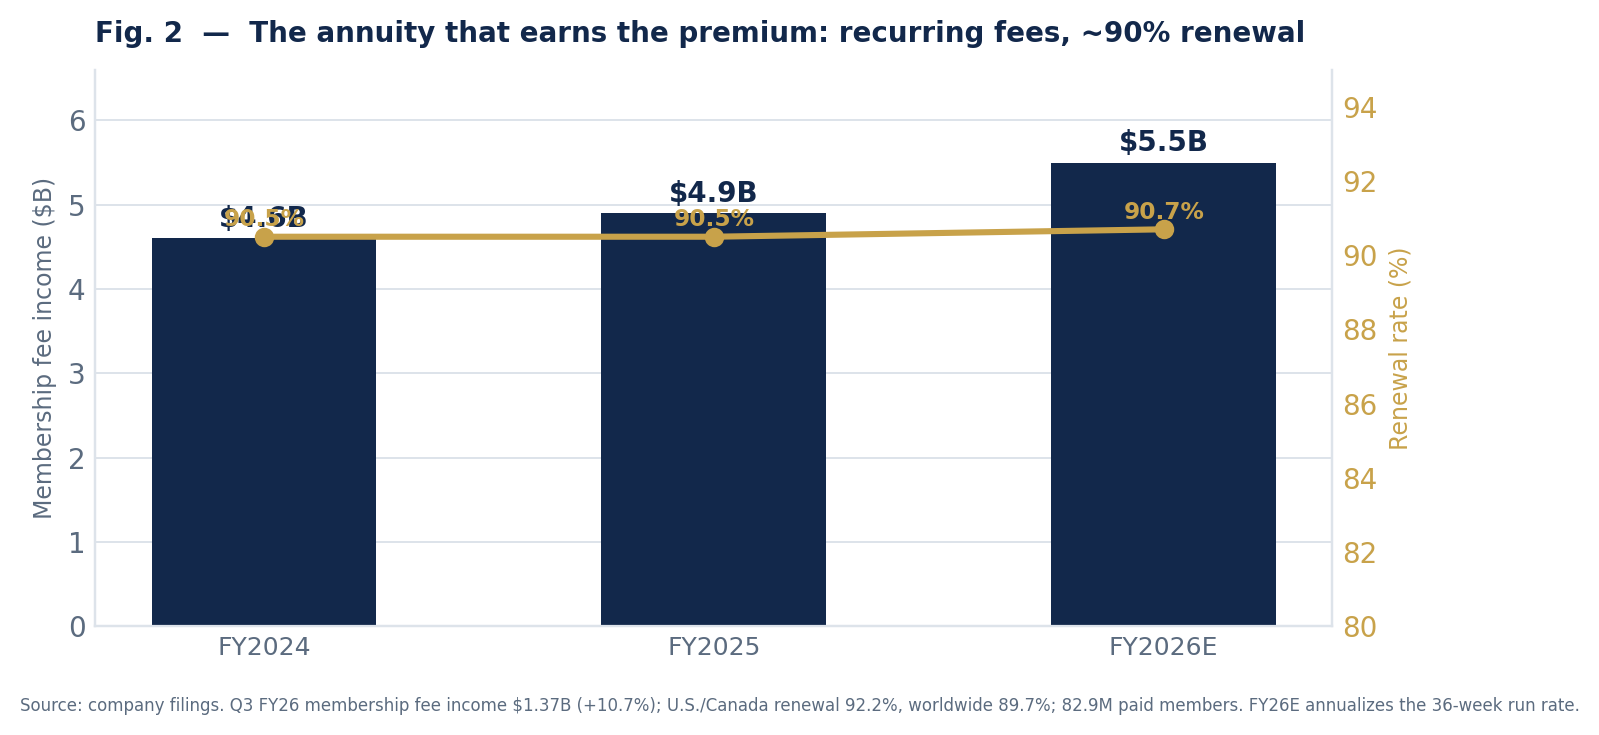
Most retailers make money selling goods. Costco barely does — it runs the merchandise close to break-even and makes its profit on membership fees. Last quarter that fee income was $1.37B, up 10.7%, at margins that flow almost entirely to the bottom line. That's a subscription business wearing a warehouse costume, and it's why the market rightly awards Costco a premium the average retailer will never earn.
The quality shows up in the renewal rate: 92.2% in the U.S. and Canada, 89.7% worldwide. Nine of ten members re-up every year, the deferred-membership liability keeps climbing, and higher-fee executive members — the most loyal, highest-spending cohort — grew 9.6% to 41.2M. This is the kind of durable, recurring economics that a quality business is built on.
A flywheel, not a gimmick
The mechanism compounds: low prices drive membership growth; more members mean more buying power; more buying power means lower prices. Fiscal Q3 2026 showed it spinning — net sales up 11.6% to $69.15B, comparable sales up 9.8% (up 6.6% stripping out gasoline and currency), and digitally-enabled comparable sales up 21.5%. Return on invested capital sits near 38%, the balance sheet holds ~$20B of cash against modest debt, and free cash flow is abundant. This is a genuinely elite operator. None of that is in dispute.
The problem is the price
Here's the entire bear case in one sentence: a great business bought at a great price is a great investment, but a great business bought at a demanding price is merely a great business. Costco today is the second kind.
What ~47x actually asks of you
At ~47x trailing and ~41x forward earnings, the earnings yield is roughly 2.1%, plus a 0.63% dividend. You're paying nearly triple the retail-staples sector median (~17x) and a clear premium to Costco's own ten-year average multiple (~39x). For that price, the market is assuming Costco compounds earnings at a double-digit clip for a very long time and that investors keep paying a near-record multiple for it. Both can happen. But you aren't being paid to be wrong about either.
The multiple is the risk — not the business
Run the arithmetic. Costco grows earnings ~11% a year. If the multiple simply drifts from ~41x forward back to its own ten-year average near 39x, that drift quietly eats most of a year's earnings growth. If it normalizes toward the low 30s — still a large premium to any peer — the stock can fall ~20% while the business does nothing wrong at all. This isn't hypothetical: it's exactly what happened to Walmart in the 2000s, a wonderful company whose stock went sideways for roughly a decade while its high-2000s multiple slowly deflated. Great company, dead money, because the entry price already banked the future.
The debate, adjudicated
We hold this position loosely, because the bull case is strong and has humiliated valuation-based skeptics for over a decade. Here's the honest exchange.
The bull case (why it stays expensive)
Our response (why we still wait)
The conclusion. We'd love to own Costco. We expect that, over a long enough horizon, its earnings will be far higher than they are today. But investing returns come from the gap between price and value, and right now that gap is closed — arguably inverted. A HOLD here isn't a criticism of Costco. It's respect for arithmetic. Buy the business; wait for the price.
Valuation and scenarios
We value COST on forward earnings. Trailing EPS is ~$19.90; we estimate ~$20.75 for FY2026E and ~$23.00 for FY2027E, roughly 11% growth, consistent with recent comps and membership trends. We anchor fair value to Costco's own ten-year average multiple (~39x) rather than a peer multiple, deliberately preserving most of the premium the business has earned.
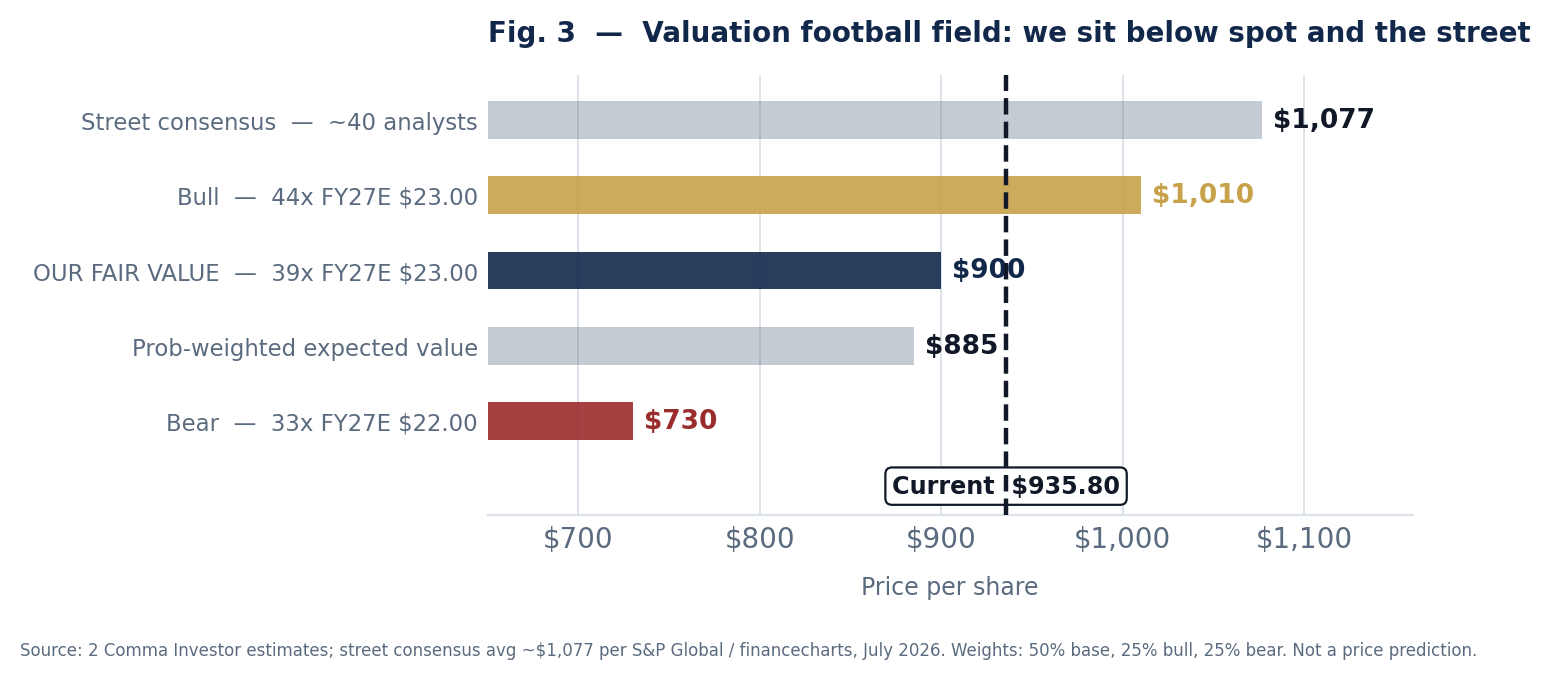
| Scenario | Weight | FY27E EPS | Multiple | Value | Return | What has to happen |
|---|---|---|---|---|---|---|
| Bull | 25% | $23.00 | 44.0× | $1,010 | +8% | The premium multiple holds near current levels; double-digit comps and membership growth continue; the market keeps paying up for quality. |
| Base | 50% | $23.00 | 39.0× | $900 | –4% | The business compounds ~11%, but the multiple drifts to its own ten-year average. You earn the earnings growth and give back some multiple — roughly flat. |
| Bear | 25% | $22.00 | 33.0× | $730 | –22% | The multiple normalizes toward the low 30s (still a big premium to peers) as growth decelerates or sentiment cools. Business is fine; the stock de-rates. |
| Weighted EV | 100% | — | — | $885 | –5% | Expected value sits ~5% below spot. The distribution is skewed to the downside: more room to fall on a re-rating than to rise on further expansion. |
This is a HOLD, not a short. We're not betting against Costco — a great business can grow into a rich multiple given enough time, and shorting quality is a good way to get hurt. We simply see no margin of safety at $935.80 and a distribution skewed to the downside. Our discipline says wait. We'd upgrade to BUY in the low $800s (~34x forward), where the price would finally offer a cushion rather than demand perfection.
| Metric | Q3 FY26A | FY2025A | FY2026E | FY2027E |
|---|---|---|---|---|
| Net sales | $69.2B | ~$264B | ~$283B | ~$310B |
| Membership fee income | $1.37B | ~$4.9B | ~$5.5B | ~$6.0B |
| Diluted EPS | $4.93 | ~$18.20 | ~$20.75 | ~$23.00 |
| Comparable sales (core) | +6.6% | — | — | — |
| Digital comps | +21.5% | — | — | — |
| Paid members | 82.9M | — | — | — |
| Renewal (U.S./Canada) | 92.2% | — | — | — |
| ROIC | ~38% | — | — | — |
| Cash & investments | ~$20B | — | — | — |
| Dividend / share | $5.88/yr | — | — | — |
What we're watching
- Fiscal Q4 / full-year 2026 results (late September). The 16-week quarter. We watch core comps (ex-gas/FX), membership fee income growth as the 2024 fee increase laps, and any commentary on a special dividend given the ~$20B cash pile.
- Monthly sales reports. Costco reports comparable sales monthly — a near-real-time read on whether the double-digit momentum holds or fades toward the high-single-digit trend of prior years.
- Membership fee increases and renewal rates. The fee annuity is the crown jewel. Any wobble in the 92% renewal rate, or the timing of the next fee hike, moves the highest-quality piece of the model.
- The multiple itself. The single biggest driver of the next year's return isn't the business — it's whether the market keeps paying ~41x forward. A drift toward the low $800s is our signal to upgrade.
Risks to the thesis (both directions)
Because this is a HOLD on a superb company, our risks run both ways — the stock can hurt us by going up as easily as down.
| Dir. | Risk | Assessment |
|---|---|---|
| UP | The multiple simply persists | The core risk to a HOLD on a great business. COST has sustained a 40–60x multiple for a decade. If it keeps doing so, we miss continued upside while we wait. This is why we HOLD rather than avoid, and why we still credit a large premium. |
| UP | Growth reaccelerates | Warehouse expansion, e-commerce (+21.5% digital comps), pharmacy/GLP-1 tailwinds, and international runway could push earnings growth above our ~11%, justifying more of the premium than we assume. |
| DOWN | Multiple normalization | The primary downside. A drift from ~41x toward the ten-year ~39x, or the low 30s, de-rates the stock ~5–22% with no operational miss at all. The higher the starting multiple, the larger this risk. |
| DOWN | Comp deceleration | Recent double-digit comps are partly gasoline- and FX-flattered; the core is ~6.6%. A fade toward mid-single digits removes the growth a premium multiple requires, and multiples compress fastest exactly when growth slows. |
| DOWN | Margin pressure | Costco deliberately runs razor-thin merchandise margins and reinvests scale into price. Cost inflation, tariffs, or a mix shift can pressure the already-slim core margin, and there's little cushion. |
| — | Key-person / execution | Costco's culture is a genuine asset and a genuine dependency. Leadership transitions and any drift in the famously disciplined culture would matter more here than at an average retailer. |
The bottom line
Costco is a wonderful business — a membership annuity with a 92% renewal rate, a widening moat, 38% returns on capital, and a fortress balance sheet. We have no argument with the company. Our argument is with the price.
At ~47x trailing earnings the stock offers no margin of safety, and its next year of return depends less on the business than on whether the market keeps paying a near-record multiple. That's a bet we decline to make here. We'd rather own this one lower.
Rating: HOLD. Fair value: $900. We'd upgrade to BUY in the low $800s (~34x forward).
Take the full note with you
8 pages, including the complete two-way risk matrix, methodology and sources.
Methodology, sources & disclosures
Methodology
Fair value derived from a probability-weighted scenario analysis applying an exit multiple to fiscal 2027 estimated EPS of ~$23.00 (roughly 11% growth on estimated FY2026 EPS of ~$20.75). The base-case 39x multiple equals Costco's own approximate ten-year average, deliberately preserving the premium the membership model has earned rather than applying a peer multiple. Bull (44x) assumes the near-current premium persists; bear (33x) assumes normalization toward the low 30s, still well above the ~17x retail-staples median. Total return combines the price change to fair value with the ~0.63% dividend yield. This is an opinion of value, not a price prediction.
Primary sources
Costco fiscal Q3 2026 earnings release and management call transcript (quarter ended May 10, 2026; reported May 28, 2026); fiscal 2026 interim Form 10-Q; company monthly sales releases. Valuation, multiple history, and consensus data per stockanalysis.com, fullratio, GuruFocus, financecharts, and macrotrends (July 2026); street average target ~$1,077. All figures reflect information available as of the July 20, 2026 close and are subject to revision; readers should verify the current price and any developments after that date before acting.
Disclosures
This report is published by 2 Comma Investor for educational and informational purposes only. It is not investment advice, and it is not a recommendation, offer, or solicitation to buy or sell any security. The author (@2commainvestor) is not a registered investment adviser, broker-dealer, or financial analyst, and no fiduciary relationship is created by reading this document.
Position disclosure: the author may hold, and may from time to time initiate or close, a position in the securities discussed. No compensation has been received from any company mentioned in exchange for this report. 2 Comma Investor has no investment banking, advisory, or business relationship with Costco Wholesale Corporation.
Forward-looking statements — including estimates, fair-value ranges, scenario weights and probability assessments — are opinions based on information believed reliable as of the publication date. They are not guarantees. Actual results will differ, potentially materially. Estimates and consensus figures are drawn from third-party sources that have not been independently verified. Past performance does not indicate future results. Investing in equities involves risk of loss, including total loss of principal. Read the full disclosures →