The Progressive Corporation (NYSE: PGR)
Initiation of coverage · Property and casualty insurance
Eleven times earnings, or twenty-three times. It depends on one number.
The full 8-page research note
Normalized earnings model, the combined ratio ladder, the monthly cycle evidence, scenarios, and full disclosures. Free, no email required.
The call
We are initiating on Progressive with a HOLD and a $208 fair value.
Progressive screens as one of the cheapest large-capitalization compounders in the market at 11.0 times trailing earnings. It is not cheap. It is a superb business priced for the fact that its margins are at a cyclical peak, and the market has already made that adjustment.
In July 2026 Progressive's combined ratio was 86.8. The company's own stated long-run objective is 96. That gap is worth more than nine points of underwriting margin, and it is the only number in this report that matters.
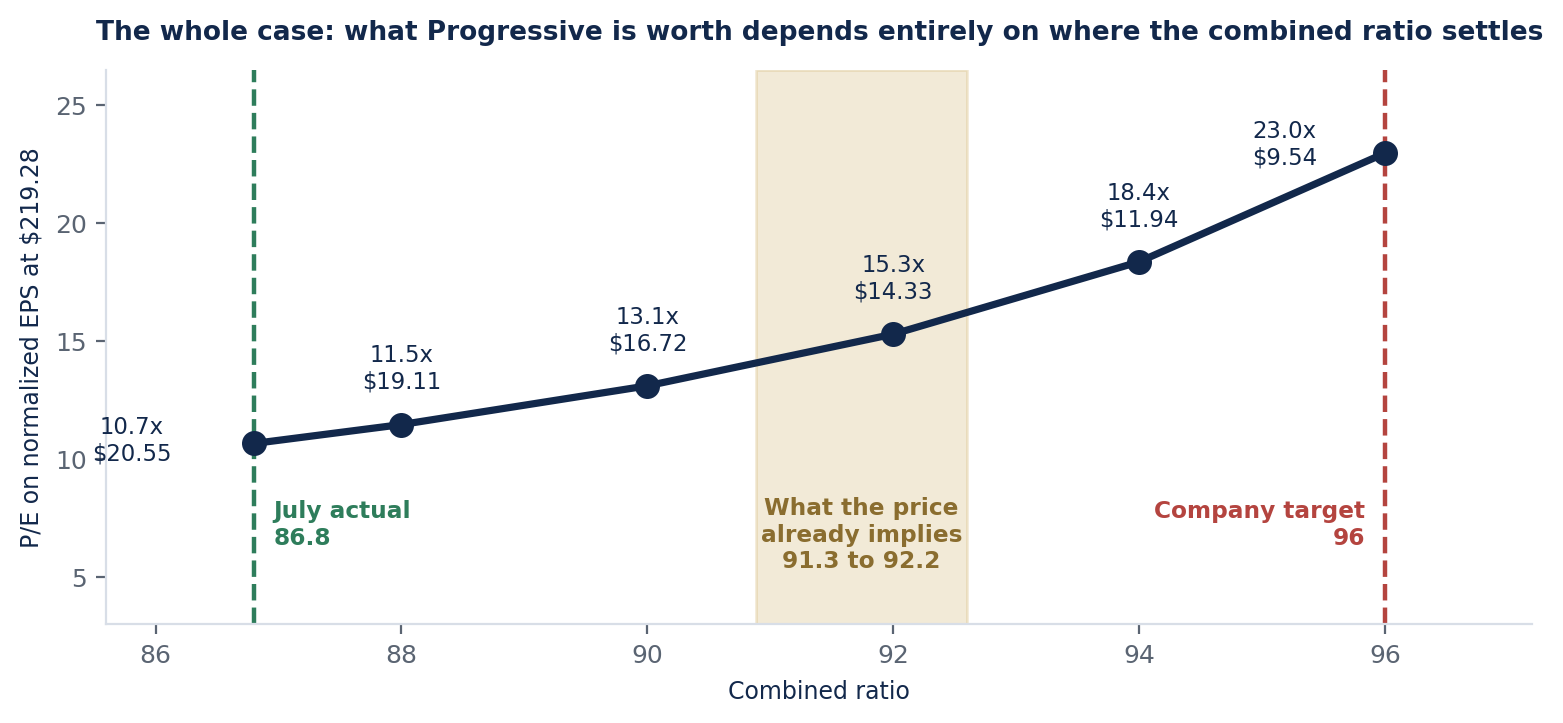
At the July ratio, normalized earnings are $20.55 a share and the stock trades at 10.7 times. At the company's own target, earnings are $9.54 and the same price is 23.0 times. Nothing about the business changes between those two numbers.
We expected to find a value trap. Instead, when we solved for the combined ratio the current price already assumes, the answer came back at 91.3. The market has done this arithmetic. That is why the shares sit 20% below their 2025 high at a multiple that looks superficially cheap.
The one number
The combined ratio is the share of premium an insurer pays out in claims and expenses. Below 100 the underwriting is profitable, above 100 it is not. For Progressive it is not a statistic, it is the operating constraint: the company has said for years that it aims to grow as fast as it can while holding a 96 combined ratio.
We rebuilt the earnings from components rather than taking reported net income at face value. Underwriting profit is net premiums earned multiplied by one minus the combined ratio. Everything else, meaning investment income and fees net of interest expense, is backed out of reported pretax income. July implies $293M a month of non-underwriting income and the June quarter implies $282M, a gap of $10M, so we are comfortable annualizing July.
| Combined ratio | Normalized EPS | P/E at $219.28 |
|---|---|---|
| 86.8 (July actual) | $20.55 | 10.7× |
| 88.0 | $19.11 | 11.5× |
| 90.0 | $16.72 | 13.1× |
| 92.0 | $14.33 | 15.3× |
| 94.0 | $11.94 | 18.4× |
| 96.0 (company target) | $9.54 | 23.0× |
This is the entire investment case in one table. The business does not change between the first row and the last. Only the point in the underwriting cycle changes, and the multiple you are paying moves by 2.2 times.
What the price already assumes
A discounted cash flow is the wrong tool here, and we want to be explicit about that departure from our usual method. For an insurer, operating cash flow is inflated by float, meaning premium collected today against claims paid years from now, and it is distorted by movements in loss reserves. Discounting it would attach false precision to the wrong quantity.
So we value normalized underwriting earnings and apply a multiple. Rather than assert a normalized ratio, we asked what ratio today's price already pays for. At 14.5 times normalized earnings, $219.28 implies a combined ratio of 91.3. At 15.5 times it implies 92.2.
That range is the finding of this report. It sits almost exactly where a reasonable mid-cycle estimate should sit: worse than the 86.8 Progressive is earning now, better than the 96 it promises. The market is not naively extrapolating peak margins, and it is not pricing disaster either.
This matters because the most common bull argument on Progressive is that 11.0 times earnings is obviously cheap for a compounder. That argument compares today's price to peak earnings. The most common bear argument is that the multiple is a value trap hiding an earnings collapse. That argument assumes the market has not noticed. Both are answered by the same calculation, and the answer is that the stock is roughly fairly valued.
Two items are worth flagging for anyone using headline numbers. The June quarter's net income of $3,311M included $604M of pretax realized gains on securities; strip them at the statutory rate and quarterly earnings per share fall from $5.67 to $4.85. And that line swung by $126M against the company in July alone. Realized gains are not underwriting and should not be capitalized at any multiple.
The clearest sign consensus agrees with this framing is the forward multiple. Progressive trades at 11.0 times trailing earnings and 13.3 times forward earnings. A forward multiple above the trailing multiple means the street already expects earnings to fall.
The cycle is turning, and you can see it monthly
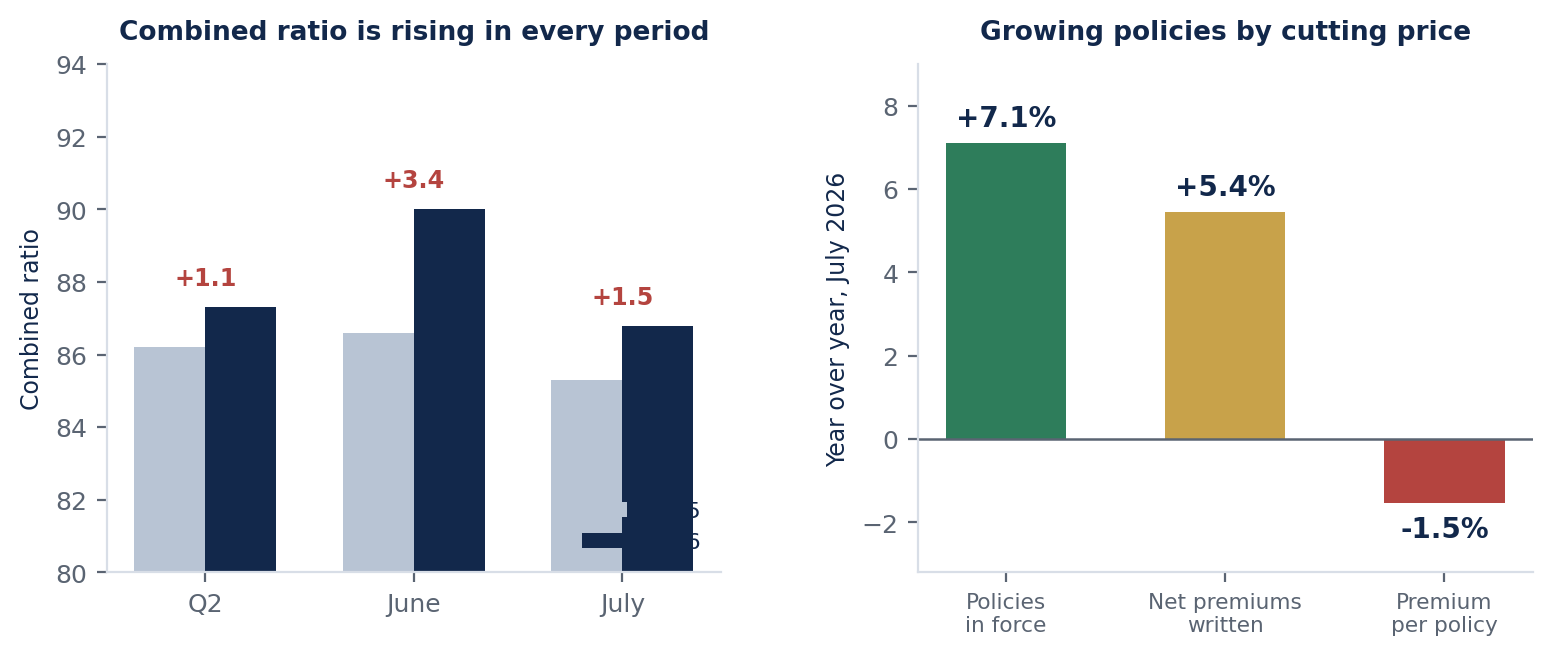
Progressive reports every month, which is unusual and, for an analyst, a gift. There is no need to wait a quarter to see the direction of travel. The combined ratio deteriorated year over year in every period we can observe: +1.1 points in the June quarter, +3.4 points in June, and +1.5 points in July. Net income fell 31% in June and 12% in July despite premiums rising, because margin is compressing faster than volume is growing.
The leading indicator is the one we think is underappreciated. In July, policies in force grew 7.1% while net premiums written grew 5.4%. Those two numbers cannot both be flattering. Written premium per policy fell roughly -1.5%.
Progressive is adding customers by charging less for each one. That is the correct competitive response when you hold a cost advantage and want share, and it is also precisely the mechanism by which an underwriting cycle turns. Rate reductions earn through over the following year, so the combined ratio Progressive prints twelve months from now is being set today.
| Policies in force | 2025 | 2026 | Growth |
|---|---|---|---|
| Direct auto | 15,392 | 16,800 | +9% |
| Agency auto | 10,510 | 11,282 | +7% |
| Special lines | 6,915 | 7,351 | +6% |
| Property | 3,622 | 3,635 | +0% |
| Commercial lines | 1,194 | 1,236 | +4% |
| Total | 37,633 | 40,304 | +7% |
Personal lines policy growth also decelerated, from 7.6% at the end of June to 7.2% at the end of July. Even the volume side is slowing.
The bull case, and why this is a HOLD and not a SELL
Everything above argues the cycle is turning. None of it argues that Progressive is a bad business, and the opposing case deserves its full weight.
The target is a floor the company keeps beating. The 96 combined ratio is an objective, not a forecast. Progressive has come in below it in most years for two decades. Its expense ratio is among the lowest in the industry, its segmentation and telematics data are genuinely better than peers, and the direct channel structurally removes commission. Assuming full reversion would be too bearish, which is why our base case uses 92.
It is taking share while the industry stands still. Total policies in force reached 40.30 million, up 7.1%, with direct auto up 9%. Share gained during a soft market compounds for years, because auto policies renew. The pricing Progressive gives up today buys an annuity it keeps.
The investment side is a separate, growing engine. Investment income and fees net of interest ran about $293M a month, roughly $3.5B a year. That grows with float, and float grows with premium. Our normalized earnings hold it flat, which is conservative.
The capital returns are serious. Progressive declared a special dividend of $13.50 a share in December 2025 on top of the regular quarterly payment. Management has an acknowledged excess capital problem, which is a better problem than the alternative.
Every one of those points is true, and on our numbers already in the price. The market implies a combined ratio of 91.3, which already credits Progressive with beating its own target by 4.7 points indefinitely. To justify buying here you have to believe the company sustains something close to current peak margins, and the monthly data is moving the other way.
Scenarios
| Bear | Base | Bull | |
|---|---|---|---|
| Normalized combined ratio | 95.0 | 92.0 | 89.5 |
| Normalized EPS | $10.74 | $14.33 | $17.32 |
| Multiple applied | 13.0× | 14.5× | 15.5× |
| Fair value | $139.61 | $207.76 | $268.44 |
| Return from today | -36.3% | -5.3% | +22.4% |
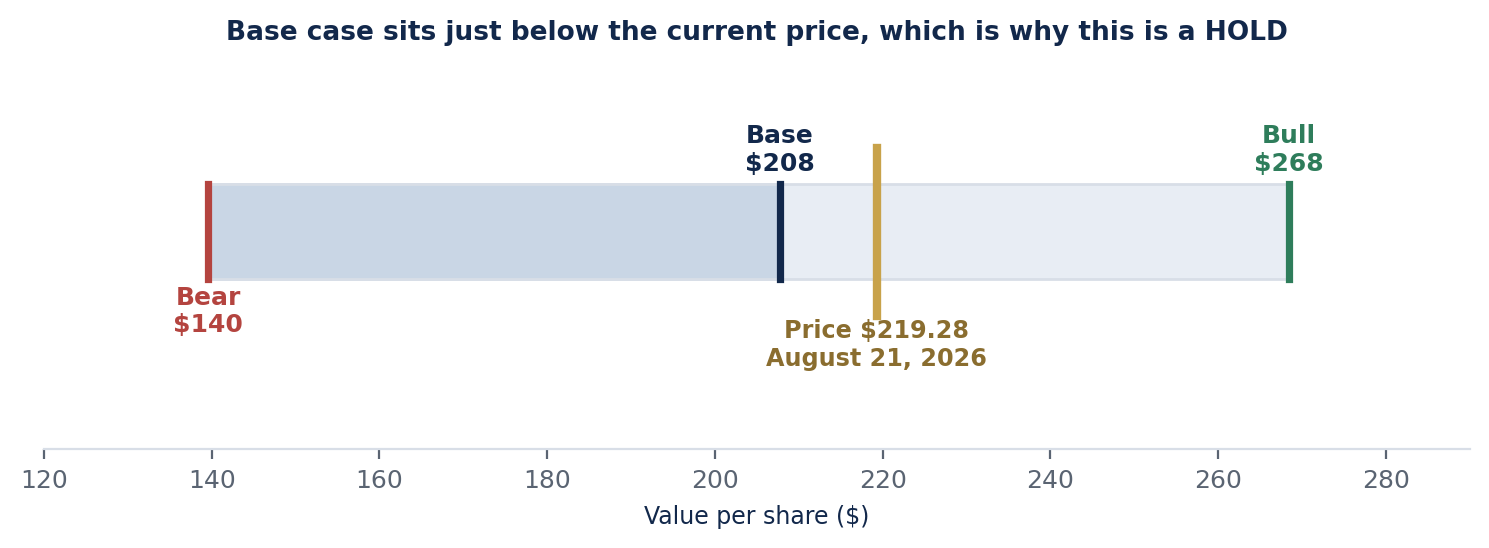
Bear. Rate cuts earn through, competitors match, and the combined ratio reaches 95, still better than the company's own target. The multiple compresses to 13 times on the way down, as it usually does for cyclicals. Fair value $140, a 36% loss.
Base. The combined ratio settles at 92, roughly where the market already has it. Progressive keeps its structural advantage but gives back most of the hard-market windfall. Fair value $208, or -5.3%, which is inside the noise band for a twelve-month call.
Bull. Progressive holds near 89.5, demonstrating the gap to peers is a permanent cost and data advantage rather than a cyclical gift. Fair value $268. This is a real possibility and it is why we are not short.
The bear case is roughly 1.6 times the magnitude of the bull case. A base case within a few percent of the current price, paired with a downside larger than the upside, is close to the definition of a HOLD.
Risks
Because this is a HOLD, the risks run in both directions, and we would rather state what would move us than pretend to certainty.
What would move us to BUY: the combined ratio stabilizing near the current level for two or three consecutive months; written premium per policy returning to positive; the price falling toward the bear case without a change in fundamentals; or property returning to growth and broadening the engine beyond auto.
What would move us to SELL: the combined ratio pushing through 93 and continuing to climb; policy growth decelerating while price per policy keeps falling; adverse reserve development on prior accident years; or a major catastrophe year in the property book.
We should also name where our method could be wrong. We hold investment income flat, and it has been growing, so we may be understating normalized earnings. We annualize a single month of net premiums earned, and the monthly series is noisy: June printed a 90.0 combined ratio against July's 86.8. And the multiple we apply carries as much of the answer as the combined ratio does. At 15.5 times rather than 14.5, our base case would be a mild BUY. That is the single most contestable input in this report.
Related research
Reports that make a similar argument about a different business. Every call on this site is dated, public and scored the same way, whether it worked or not.
- JPMorgan Chase, the other financial, valued on tangible book against returns rather than on earnings.
- Nike, another report where normalizing the denominator changes the answer entirely.
- Texas Pacific Land, a business whose reported earnings understate what a normal year looks like.
The full list, with the price each call was made at, is on the scoreboard.
Sources & scoring
All company figures are taken from primary sources: the July 2026 results release of August 19, 2026, and the June 2026 release of July 15, 2026 covering the month and the quarter ended June 30. Trailing and fiscal-year aggregates are from S&P Global Market Intelligence. Every figure was computed by script from those documents.
The reference price of $219.28 is the closing price on August 21, 2026, the last trading day before publication, on the S&P Global Market Intelligence and CBOE consolidated tape. Our corrections policy requires agreement across independent sources. We obtained one high-quality quote timestamped to the closing auction and confirmed it with the editor before publication. Two widely used secondary sources were checked and rejected: one was serving a cached quote from December 2025, and one reported a 52-week range inconsistent with every other source. The prior session closed at $220.34.
This call will be scored on August 22, 2027 against the total return of the S&P 500 over the same period. A HOLD is recorded as correct if the excess return of PGR against the benchmark falls within five percentage points in either direction. The rule was fixed before the result is known and will not be revised afterward. See how calls are scored.
The full 8-page research note
The full model, the combined ratio ladder, the monthly cycle evidence, the two-way risk table, and methodology.