Initiation of coverage · Semiconductors
Taiwan Semiconductor (NYSE: TSM)
The toll booth on the entire AI build-out, marked down while earnings doubled.
The full 8-page research note
Valuation model, football field, the bear-case debate, and full disclosures. Free, no email required.
TSMC doesn't have to pick the winner of the AI race. It collects a toll from every entrant.
The call
We're initiating on Taiwan Semiconductor with a BUY and a $485 fair value.
Nearly every advanced AI chip in the world (Nvidia's accelerators, Apple's silicon, the custom parts designed by Amazon and Google) is physically manufactured by one company. TSMC holds roughly 70% of the dedicated foundry market and a near-monopoly at the leading edge. It doesn't have to pick the winner of the AI race. It collects a toll from every entrant.
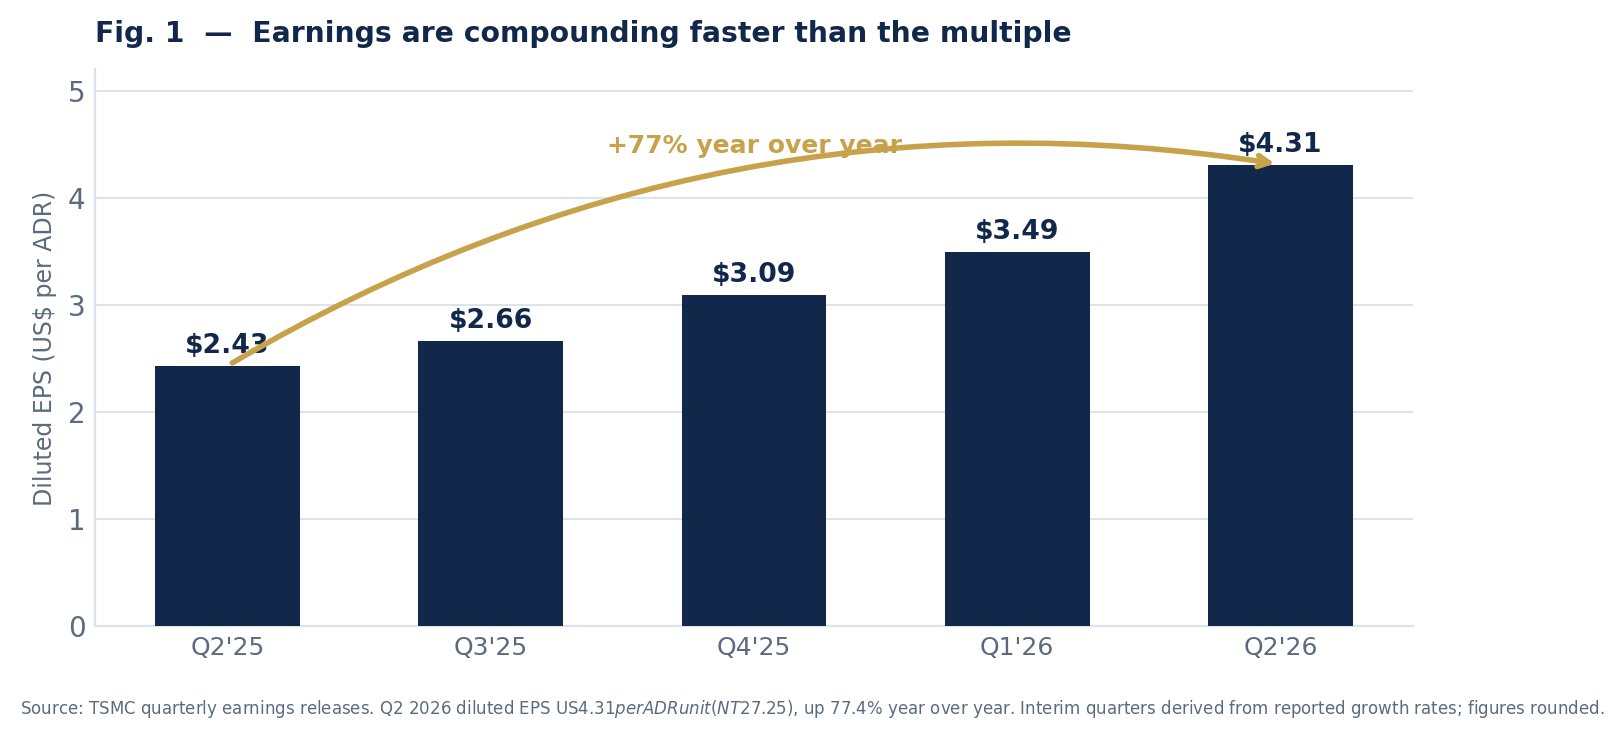
In the quarter reported July 16, that toll booth produced $40.2B of revenue, up 33.7%, at a 67.7% gross margin, with diluted earnings per ADR of $4.31, up 77.4% year over year. Management then raised full-year 2026 revenue growth guidance to above 40%, from 30% previously. Earnings nearly doubled and the outlook went up.
The stock fell anyway. A sector-wide selloff, plus a capital-expenditure guidance raise to $60–$64B from $52–$56B, shifted the market's attention from growth to free-cash-flow compression. Shares now sit around $404.25, roughly 16% below the 52-week high. That leaves a business compounding earnings at a double-digit-plus rate trading near 23x our FY2026 estimate and ~18x FY2027, at or below its own five- and ten-year average multiples, despite far faster growth than either period.
We think that's the opportunity, and we're explicit about the reason to say no: this is a Taiwanese company, and a military event in the strait is a permanent-impairment risk that no multiple captures. That risk is real, unquantifiable, and the reason this is a position to size carefully rather than concentrate in.
| Market cap | ~$2.1T | ADR ratio | 1 ADR = 5 shares |
| Q2'26 EPS / ADR | $4.31 (+77.4%) | Q2'26 revenue | $40.20B (+33.7%) |
| Gross margin | 67.7% | Operating margin | 60.3% |
| Forward P/E (FY26E) | ~23× | Forward P/E (FY27E) | ~18× |
| 10-year average P/E | ~22× | ROE / ROIC | ~40% / ~55% |
| Net cash | ~$80B | Dividend / yield | $2.76 / 0.7% |
| 52-week range | $223.70–$479.00 | Street consensus | Buy, ~$490–$532 |
The toll booth
Why the foundry beats the chip designer
Investing in the AI build-out usually means picking which chip designer wins, Nvidia against AMD, custom silicon against merchant parts. That's a genuinely hard call, and getting it wrong is expensive. TSMC sidesteps the question entirely. All of those designs are fabless; someone has to actually etch them into silicon, and at the leading edge there is effectively one company that can. Roughly 70% of the dedicated foundry market, and a far higher share of advanced nodes, runs through TSMC's fabs.
That's a structurally better position than the one we underwrote at Qualcomm two weeks ago. Qualcomm is a designer competing for sockets. TSMC is the road every design has to drive on. Advanced nodes at 7nm and below now generate roughly 77% of wafer revenue, and the moat is capital, not brand: a leading-edge fab costs tens of billions and years to build, which is precisely why the competitive set has thinned rather than widened.
The economics of a monopoly at the choke point
The pricing power shows up in the margin structure. Second-quarter gross margin was 67.7% and operating margin 60.3%, numbers that belong to a software company, earned by a business that runs the most capital-intensive factories on earth. Return on equity is near 40% and return on invested capital near 55%. The balance sheet carries roughly $80B of net cash. Reports of wafer price increases of up to 10% beginning in 2027 tell you who holds the leverage in these negotiations.
What actually happened in July
The setup here is a disagreement between the operating results and the share price, so it's worth being precise about both.
The results
- Revenue $40.20B, up 33.7% year over year and 12.0% sequentially, above the midpoint of guidance.
- Net income NT$706.56B, up 77.4%; diluted EPS of NT$27.25, or $4.31 per ADR unit, also up 77.4%.
- Gross margin 67.7%, operating margin 60.3%, net margin 55.6%.
- Guidance raised: Q3 revenue of $44.6–$45.8B (roughly 37% growth at the midpoint), and full-year 2026 revenue growth lifted to above 40%, from 30% previously.
The reaction
Shares fell. Three things drove it. First, management raised 2026 capital expenditure guidance to $60–$64B from $52–$56B, roughly $8B of additional spending, on the order of 36% of estimated 2026 revenue. Second, third-quarter gross margin guidance of 65–67% came in modestly below consensus, reflecting the cost of ramping 2-nanometer production and building fabs overseas. Third, and largest, a sector-wide correction hit semiconductors generally, on profit-taking after a historic run and renewed questions about how long AI capital spending can compound.
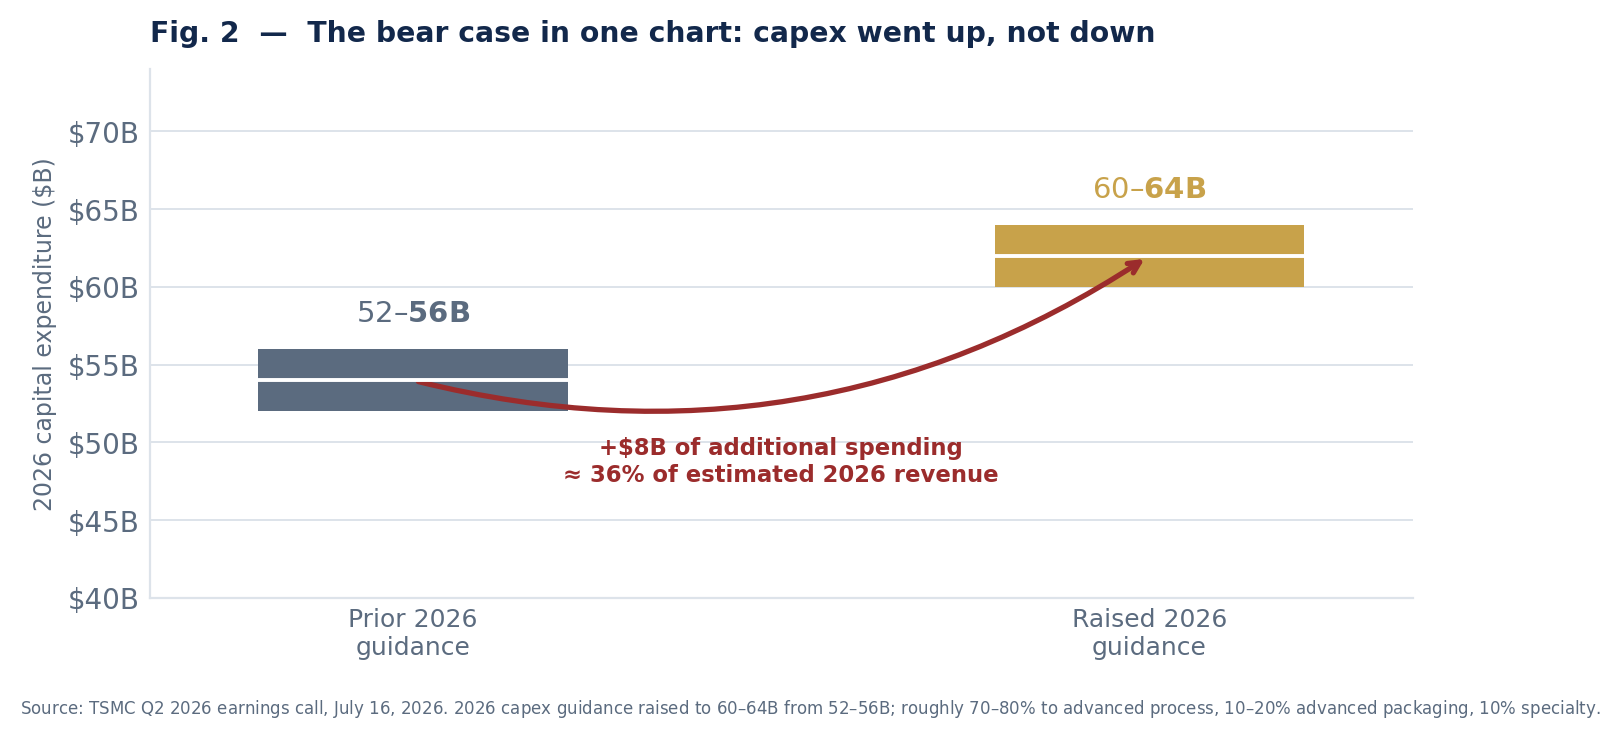
We take the capex concern seriously, and we think the market has the sign wrong. TSMC isn't raising capital spending because costs ran away from it; it's raising spending because customers are asking for capacity it doesn't yet have, and management said the next three years of capital spending will significantly exceed the last three. Heavy capex does compress free cash flow in the near term; that part is true and unavoidable. But capacity added at 60%+ operating margins into demand that is visibly present is the good kind of spending. The bad kind is capacity built into demand you're hoping shows up.
The debate, adjudicated
This is the most two-sided name we've covered. The bear case isn't a strawman; one branch of it is genuinely unanswerable, and we say so.
The bear case
Our response
How we hold both ideas at once. The business quality and the entry price both argue for owning TSMC. The geopolitical tail argues for owning less of it than the numbers alone would suggest. Those aren't contradictory conclusions; they're what position sizing is for. A BUY rating is a statement about expected value, not a recommendation to concentrate.
Valuation and scenarios
A word on mechanics first, because this is where TSM analysis most often goes wrong. TSMC reports in New Taiwan dollars on its Taiwan-listed ordinary shares (TWSE: 2330). One NYSE ADR represents five ordinary shares. Quoted price-to-earnings ratios for TSM vary wildly across data providers because some divide a U.S. dollar price by a New Taiwan dollar earnings figure. We use the company's own per-ADR U.S. dollar conversions throughout: reported Q2 2026 diluted EPS of $4.31 per ADR.
Building forward: we estimate ~$17.80 per ADR for FY2026 and ~$22.00 for FY2027, derived from company revenue guidance and reported margin structure. At $404.25 that's roughly 23x FY2026E and ~18x FY2027E, against a ten-year average multiple near 22x and a five-year average near 23x, for a business growing considerably faster now than it did across either of those periods.
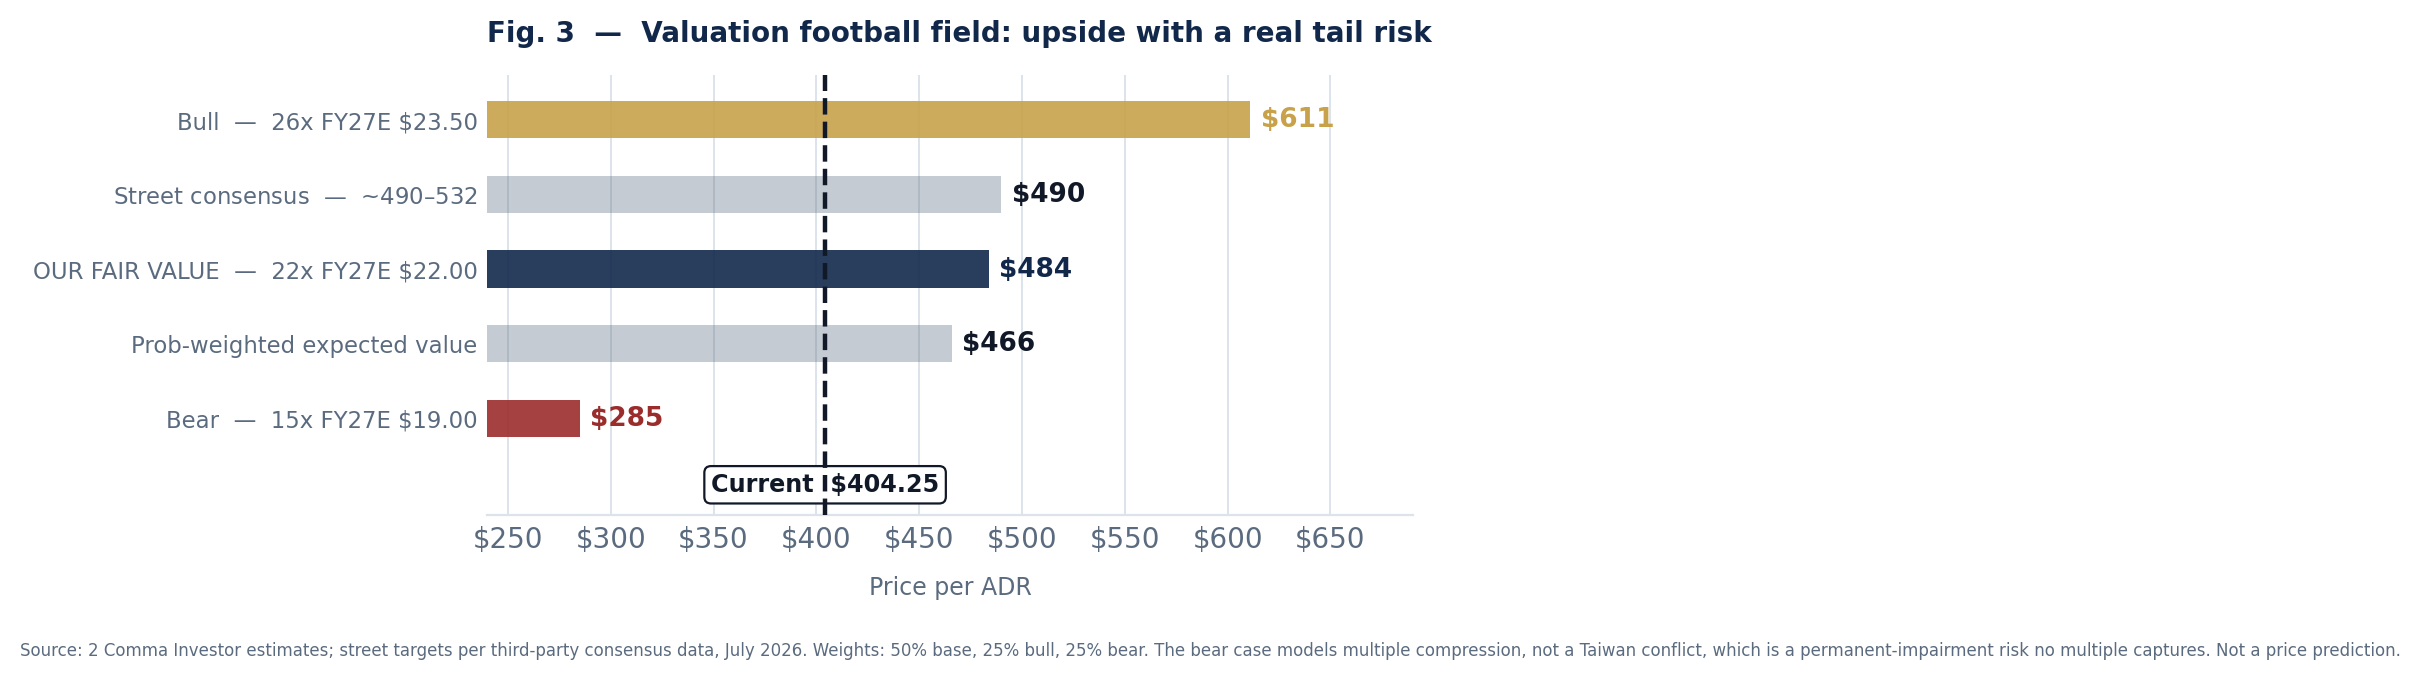
| Scenario | Weight | FY27E EPS | Multiple | Value | Return | What has to happen |
|---|---|---|---|---|---|---|
| Bull | 25% | $23.50 | 26.0× | $611 | +51% | AI demand proves durable, 2027 wafer price increases stick, 2nm ramps cleanly, and the multiple re-rates toward the growth rate. |
| Base | 50% | $22.00 | 22.0× | $484 | +20% | Growth moderates from 40% toward the mid-20s, margins absorb the overseas-fab and 2nm ramp costs, and the multiple simply holds near its own long-run average. |
| Bear | 25% | $19.00 | 15.0× | $285 | –29% | AI capital spending digests, utilization slips, and the multiple compresses to a cycle trough. Note: this models a demand and margin cycle, not a Taiwan conflict. |
| Weighted EV | 100% | n/a | n/a | $466 | +15% | Expected value sits ~16% above spot even after weighting the bear case at one in four. The distribution is positively skewed. |
Our fair value is the base case: $485, roughly 20% above the current price including the ~0.7% dividend. Note that we sit below the street, whose average target clusters around $490–$532; our bear weighting is heavier than consensus. The spread between the bull and bear outcomes here is unusually wide, which is an honest reflection of the uncertainty rather than a modeling artifact. Position size accordingly.
| Metric | Q2 FY26A | Q1 FY26A | FY2026E | FY2027E |
|---|---|---|---|---|
| Revenue (US$) | $40.20B | ~$35.9B | ~$172B | ~$215B |
| Revenue growth (YoY) | +33.7% | n/a | ~+41% | ~+25% |
| Gross margin | 67.7% | n/a | ~66–68% | ~65–67% |
| Operating margin | 60.3% | n/a | ~59–60% | ~58–60% |
| Net margin | 55.6% | ~50.5% | ~54% | ~53% |
| Diluted EPS / ADR | $4.31 | ~$3.49 | ~$17.80 | ~$22.00 |
| EPS growth (YoY) | +77.4% | n/a | n/a | ~+24% |
| Capital expenditure | n/a | n/a | $60–$64B | n/a |
| Net cash | ~$80B | n/a | n/a | n/a |
| Dividend / ADR | $2.76/yr | n/a | n/a | n/a |
What we're watching
- Monthly revenue releases. TSMC reports revenue every month; the fastest available read on whether AI demand is holding. June 2026 revenue rose 67.9% year over year; a deceleration here would show up long before it reaches an earnings report.
- Q3 2026 results (October). Guidance is $44.6–$45.8B with gross margin of 65–67%. We watch whether the 2nm ramp and overseas fabs pressure margins more than guided.
- The 2027 price increases. Reported wafer price hikes of up to 10% are the cleanest test of pricing power. If customers absorb them, the moat is confirmed; if they push back, the bear case on margins gains force.
- Capital-expenditure discipline. Spending above the $60–$64B envelope without a matching demand signal would be the first real warning that this cycle is turning into the classic semiconductor overbuild.
- Cross-strait developments. Not a variable we can forecast, but the one that most changes the appropriate size of the position.
Risks to the thesis
| Sev. | Risk | Assessment |
|---|---|---|
| HIGH | Taiwan geopolitical conflict | The dominant risk and the reason for careful sizing. A blockade or military action would impair the asset base and re-rate the sector regardless of operating performance. We deliberately exclude this from our bear case because it's a permanent-impairment scenario, not a multiple scenario. Readers unwilling to carry unhedgeable tail risk should not own this security at any price. |
| HIGH | AI capital-spending digestion | Growth above 40% is not a perpetual run rate. If hyperscaler spending pauses, utilization and pricing fall together and the multiple compresses fastest at exactly that moment. This is our modeled bear case: roughly 29% downside. |
| MED | Margin dilution from overseas fabs | U.S., Japanese and European fabs carry structurally higher costs than Taiwanese ones, and political pressure to onshore is increasing. A $200B-scale overseas footprint pressures the 67%+ gross margin that underwrites the valuation. |
| MED | Free-cash-flow compression from capex | Capital spending of $60–$64B against roughly $172B of estimated revenue absorbs a large share of operating cash flow. Even in the bull case, near-term free cash flow is materially lower than earnings alone would suggest. |
| MED | Customer concentration | The top ten customers represent roughly 85% of accounts receivable. A pause from one or two of the largest buyers would move results meaningfully. |
| LOW | Currency translation | Results are reported in New Taiwan dollars while the ADR is priced in U.S. dollars. Exchange-rate moves affect reported growth rates and per-ADR figures independently of operating performance. |
The bottom line
TSMC manufactures nearly every advanced AI chip on earth, holds roughly 70% of the foundry market, earns software-like margins on the most capital-intensive factories in the world, and just grew earnings 77% year over year while raising full-year guidance. The stock fell anyway, on a capex raise and a sector-wide correction, and now trades near 23x this year's estimate and ~18x next year's, at or below its own long-run average multiples, with growth well above its long-run average.
The reason it's cheap isn't a mystery, and we won't pretend otherwise: this is a Taiwanese company, and that risk can't be modeled away. Our answer is to own it with clear eyes and a sensible position size rather than to demand a price that compensates for a risk no price can compensate for.
Rating: BUY. Fair value: $485. Sized carefully.
Take the full note with you
8 pages, including the complete risk matrix, methodology and sources.
Methodology, sources & disclosures
Methodology
Fair value derived from a probability-weighted scenario analysis applying an exit multiple to estimated fiscal 2027 earnings of ~$22.00 per ADR. Per-ADR earnings estimates are built from company revenue guidance (Q3 2026 of $44.6–$45.8B; full-year 2026 growth above 40%) and the reported margin structure, using the company's own U.S. dollar per-ADR conversions and an ADR ratio of five ordinary shares per ADR. The base-case 22x multiple approximates TSMC's own ten-year average. Bull (26x) assumes a re-rating toward the growth rate; bear (15x on lower earnings) assumes a demand-and-margin cycle, and deliberately does not attempt to price a Taiwan military conflict, which is a permanent-impairment risk rather than a multiple scenario. Total return combines the price change to fair value with the ~0.7% dividend yield. This is an opinion of value, not a price prediction.
Primary sources
TSMC second-quarter 2026 earnings release and Form 6-K filed with the SEC (quarter ended June 30, 2026; reported July 16, 2026); TSMC Q2 2026 earnings conference call and management guidance; TSMC monthly revenue releases; TSMC investor relations financial calendar. Price, multiple history and consensus data per third-party providers including stockanalysis.com, GuruFocus, financecharts, macrotrends and investing.com (July 2026). Reference price of $404.25 is the July 31, 2026 close. All figures are subject to revision; readers should verify the current price and any developments after that date before acting. Company filings and investor materials read directly at investor.tsmc.com/english; filings as submitted via SEC EDGAR.
Disclosures
This report is published by 2 Comma Investor for educational and informational purposes only. It is not investment advice, and it is not a recommendation, offer, or solicitation to buy or sell any security. The author (@2commainvestor) is not a registered investment adviser, broker-dealer, or financial analyst, and no fiduciary relationship is created by reading this document.
Position disclosure: the author may hold, and may from time to time initiate or close, a position in the securities discussed. No compensation has been received from any company mentioned in exchange for this report. 2 Comma Investor has no investment banking, advisory, or business relationship with Taiwan Semiconductor Manufacturing Company Limited.
Specific risk note: this security is an American Depositary Receipt of a company domiciled in Taiwan and carries geopolitical risk that is not quantifiable and cannot be hedged within the position. Nothing in this report should be read as a view on the likelihood of any geopolitical event. Readers unwilling to bear unhedgeable tail risk should not own this security at any price.
Forward-looking statements (including estimates, fair-value ranges, scenario weights and probability assessments) are opinions based on information believed reliable as of the publication date. They are not guarantees. Actual results will differ, potentially materially. Estimates and consensus figures are drawn from third-party sources that have not been independently verified. Past performance does not indicate future results. Investing in equities involves risk of loss, including total loss of principal. Read the full disclosures →